In mijn eindexamenjaar, 1991, kregen we kwantumfysica bij scheikunde en
natuurkunde. Bij scheikunde ging het vooral over de discrete banen
(golffuncties) waarin elektronen zitten. Logische vraag is dan natuurlijk hoe
die banen eruit zien. Deze ogenschijnlijk makkelijke vraag levert een moeilijk
antwoord in de vorm van de Schrödinger-vergelijking. De oplossingen
daarvan leveren functies, die de kans geven dat een elektron op een bepaalde
plaats is. (Mijn excuus aan de echte kwantumfysici voor mijn onzuiver
taalgebruik.)
[In my final year in highschool, 1991, we had quantum physics at chemistry
and physics. In chemistry the main interest laid in the discrete orbits
(wavefunctions) of the electrons. Logical question was, of course, how those
orbits looked like. This apparently easy question has a more difficult answer
in the form of the Schrödinger-equation. The solutions of this give
functions that give the probability of an electron being at a specific
location. (My apologies to the real quantum physicists for my impure use of
language.]
Omdat ik net was begonnen met programmeren, leek het mij leuk om te kijken of
ik van die oplossingen kon vinden en daar dan een visualisatie van maken.
[Because I just started programming, it looked like a nice idea to see if I
could find some solutions and make a visualization of it.]
"ATOOM" is gemaakt met behulp van een aantal oplossingen van de
Schrödinger-vergelijking:
["ATOOM" has been made with a number of solutions of the
Schrödinger-equation:]
|
∂2 Φ(x,y,z)
∂ x2 |
+ |
∂2 Φ(x,y,z)
∂ y2 |
+ |
∂2 Φ(x,y,z)
∂ z2 |
+ |
8 π2 m
h2 |
( | E - V(x,y,z) | ) | Φ = 0 |
Deze vergelijking beschrijft de kans om een elektron van een atoom ergens te
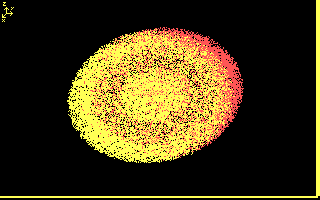
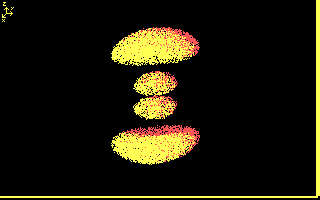
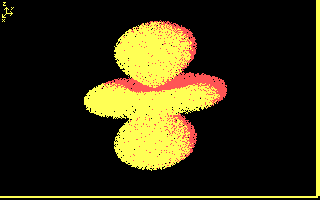
vinden. De plaatjes geven dus aan waar een elektron, met een zekerheid van 90%,
zal zijn.
[This equation describes the probability to find an electron of a atom at
certain locations. The pictures thus show where the electron, with a certainty
of 90%, will be.]
De hier gebruikte oplossingen gelden voor atomen met 1 elektron.
[The solutions in this program are valid for atoms with 1 electron.]
Het elektron kan in verschillende banen zitten: De n geeft de grootte van het
atoom aan, de l de vorm en de m bepaalt de baan van het elektron. De n en de l
bepalen dus het niveau en de m bepaalt de eigenlijke baan.
[The electron can be in different orbits: The n gives the size of the atom,
the l the form and the m determines the specific orbit of the electron. The n
and the l, therefore, determine the level and the m determines the actual
orbit.]
Je kunt met dit programma het drie-dimensionale (3D) atoom op verschillende
manieren bekijken:
[This program lets you display the three-dimensional (3D) atoms in different
ways:]
Dit programma is gemaakt met medewerking van een drietal scheikundigen
[This program has been made with the help of three chemists]
H. Geut
A. Riedstra
H. Risselada
Mijn dank daarvoor. [My thanks for their help.]
Voor versie 2.0+ van ATOOM is vrijwel al het reken- en tekenwerk in
machine-taal gemaakt. Hierdoor kan ATOOM versie 2.0 snel de vele punten voor
een plaatje berekenen en tekenen.
[In version 2.0+ of ATOOM, virtually all calculations and drawing is done in
machine-code. Because of this, ATOOM version 2.0 can calculate and plot the
many points for a single image relatively quickly.]
Inmiddels is deze snelheid nog nauwelijks van belang, maar ATOOM is geschreven
voor 4.77MHz PCs zonder floating-point processor. Daar maakte deze
snelheidswinst zeker uit!
[At present, this speed is not of great importance anymore, but ATOOM was
originally written for a 4.77MHz PC without floating-point processor. For such
a machine, these improvements certainly made a difference!]
Introductie scherm. [Introduction screen.]


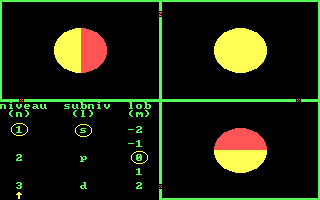
Drie aanzichten van de 1s baan. [Three views of the 1s orbit.]
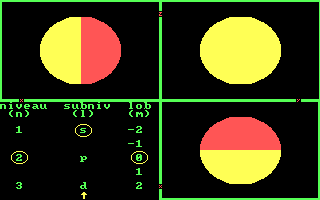
Drie aanzichten van de 2s baan. [Three views of the 2s orbit.]
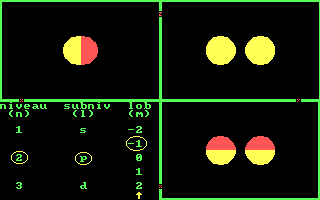
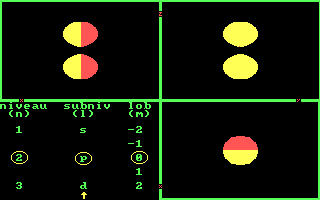
Drie aanzichten van de 3 2p banen. [Three views of the 3 2p orbits.]
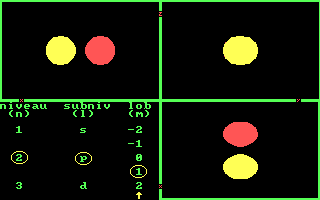
Drie aanzichten van de 3s baan. [Three views of the 3s orbit.]
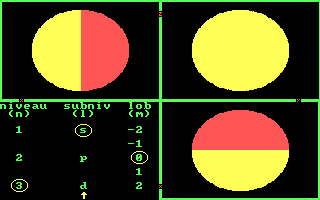
Drie aanzichten van de 3 3p banen. [Three views of the 3 3p orbits.]
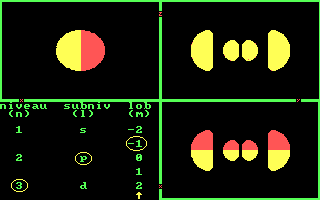
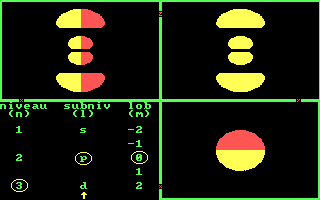
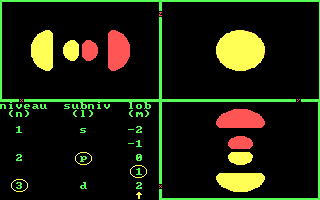
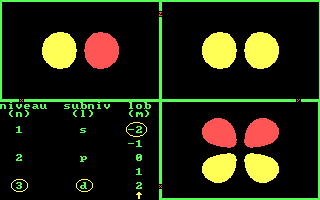
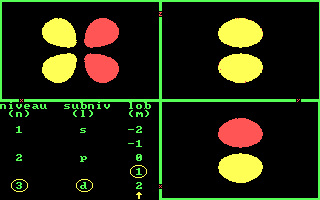
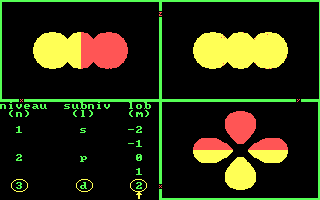
Drie aanzichten van de 5 3d banen. [Three views of the 5 3d orbits.]
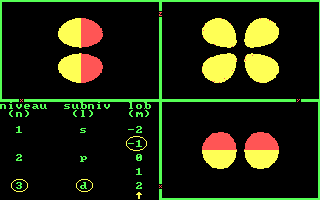
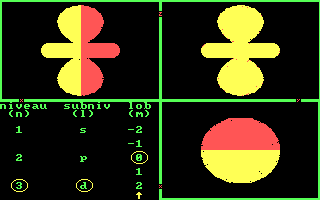
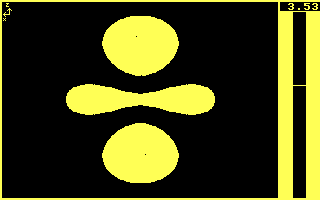
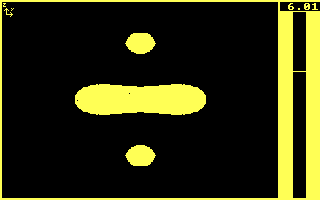
Doorsnede van de 3d0 baan. Met de schuif aan de rechterkant kan van voor naar achter plakjes bekeken worden. [Slices of the 3d0 orbit. With the slider at the right controlling the level where the slice is.]
Ruimtelijke visualisatie van de 3s, 3p0 en 3d0 banen. Duidelijk te zien is dat deze banen uit schillen bestaan. [Spatial visualization of the 3s, 3p0 and 3d0 orbits. It shows clearly that the orbits consist of different shells.]
